
Ranking Data Animation
- Cobalt ranking board
- Horizontal bars
- Coral contestant
- Visible overtake
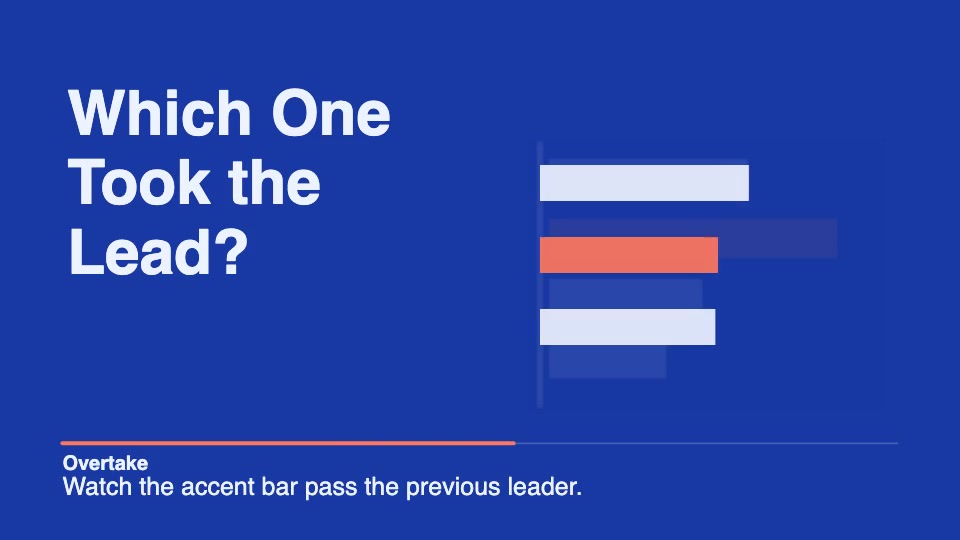
Animate a change in ranking
This 24-second example uses invented values for three contestants. The orange bar passes the leader as later observations arrive.
- Show the starting order. Give each bar a stable label and keep units consistent.
- Show the lead change. Change the bars at the recorded dates and keep the time label visible.
- Hold the final ranking. Leave the last date and order on screen long enough to compare.
Prepare one row per category and date with the measured value. Keep ties explicit and check the final order against the source table.
Read the animated explainer guide