How to Make an Animated Explainer Video from a Script
Pick one sentence your audience needs to see. Show the starting state, animate one change, then hold on the result. Review the preview with the sound off. Can you still tell what changed?
Choose an animation example for your script
- Explaining where a wave comes from? Start with the unit circle to sine wave example and keep the circle and graph visible together.
- Explaining a change over one interval? Start with the line chart example and keep both axes in view.
- Comparing conditions in a research figure? Start with the research figure example and preserve the scale, units and uncertainty. See the four-shot NASA GISS chart example.
Then adapt the sample brief to the change your script needs to explain.
Watch the 12-second night lighting example for a comparison of changing sources of light in one place.
Changing the time of day in a layered scene? Animate a cut-paper night-to-morning transition.
Showing how a miniature comes together? Storyboard a miniature stop motion assembly.
Watch the 12-second bicycle design animation example.
Teaching a calculation? Plan four shots for a worked equation.
Plan four timed reveals on one notebook page.
Sync animation to narration cues.
Teaching probability? Animate a birthday paradox simulation.
Explaining why a choice leaves the odds unchanged? Storyboard the illusion of control with a coin toss.
Explaining set operations? Animate four Boolean operations with two overlapping circles.
Showing a route through fixed stations? Animate a flow diagram with one moving marker.
Drawing the path itself? Animate a whiteboard arrow with a stroke reveal.
Animate a 3D depth axis with a fixed origin.
Adapting a slide for another language? Localize a teaching slide without changing the chart.
Animate an ASCII character from glyph to byte.
Turn a source paragraph into three checkable visual beats.
Animate why the Moon keeps falling with two labeled arrows.
Animating a landing? Block a bouncing ball with squash and stretch.
Storyboard a science fiction teaser in four beats.
Storyboard a pixel metaphor with three HUD states.
Here is how those steps work for a line from a technical script.
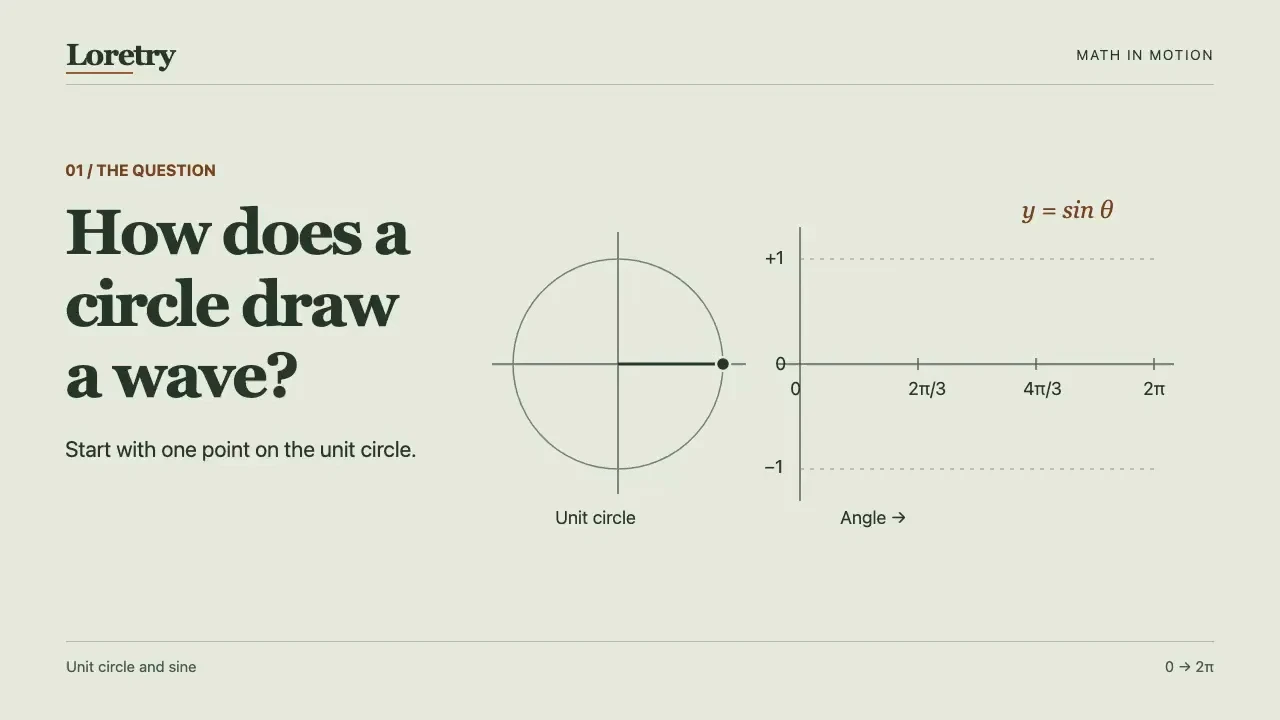
Plot the height of a point as it moves around a unit circle, and you get a sine wave.
The viewer needs to see where the wave comes from. Put the circle and graph side by side.
Pick the fact the animation needs to show
The vertical coordinate of a point on the unit circle is the sine of its angle. One full turn gives you one period.
Give the viewer something to follow
A horizontal guide carries the point's height from the circle to the graph. The trace stays on screen as the point moves.
Check your sine wave animation at five angles
Pause your scene at each angle. The graph marker should be at (angle, height) in graph coordinates and line up horizontally with the point on the circle.
Expected graph positions for one turn of the unit circle Angle (radians) Height 0 0 π/2 1 π 0 3π/2 −1 2π 0 Make the turn take twice as long in your scene. At the same five angles, the marker should still hit the same graph positions. If the trace runs ahead of the circle, use the same angle to drive both.
Using this guide with an agent
The sample brief is written for an agent-based animation workflow.
Loretry provides free previews. Model, API and rendering costs are separate.
See the agent workflow or review Skill access and pricing before you start.
Try this brief with your agent
Show one complete turn of a point around a unit circle. Keep the circle and graph visible. Use a horizontal guide to turn the point’s height into a line on the graph. Let the viewer see the finished trace. Deliver an editable scene and a preview.Watch the 19-second unit circle to sine wave animation
A shot list for animating a research figure
Start with a figure you have permission to use or can redraw, its caption and the original data or axis definitions. Choose one comparison the audience can check.
- Show the panel. Start with the whole figure and identify the panel by its label.
- Read the axes. Name what each axis measures. Keep the original axis ranges, units and uncertainty visible.
- Compare one pair. Highlight the two conditions on the same scale. Let viewers see the reference condition while you show the difference.
- State what the panel supports. Use the claim supported by the caption and data. Leave causal language for cases where the study design supports it.
Try it on NASA GISS’s temperature chart. The black line marks annual estimates in degrees Celsius relative to the 1951–1980 average. The gray band shows each year’s 95% confidence interval.
Keep the full year axis and gray band visible. Mark 1980 at 0.26 °C (±0.046 °C) and then 2024 at 1.28 °C (±0.054 °C). Hold both markers on the same scale. The two annual estimates are 1.02 °C apart. Keep each uncertainty interval with its year marker.
Open the original NASA GISS chart and data
The 24-second Loretry preview uses an illustrative figure. Follow its shot order with the NASA chart.
Watch the 24-second research figure exampleFor a single line chart, keep both axes in view and pick one interval to explain. Watch the 12-second line chart example to see how to hold the scale and call out one value.