
Sine Wave Animation: From a Unit Circle
- Sage paper
- Shared baseline
- Horizontal projection
- Continuous trace
How a Circle Draws a Sine Wave
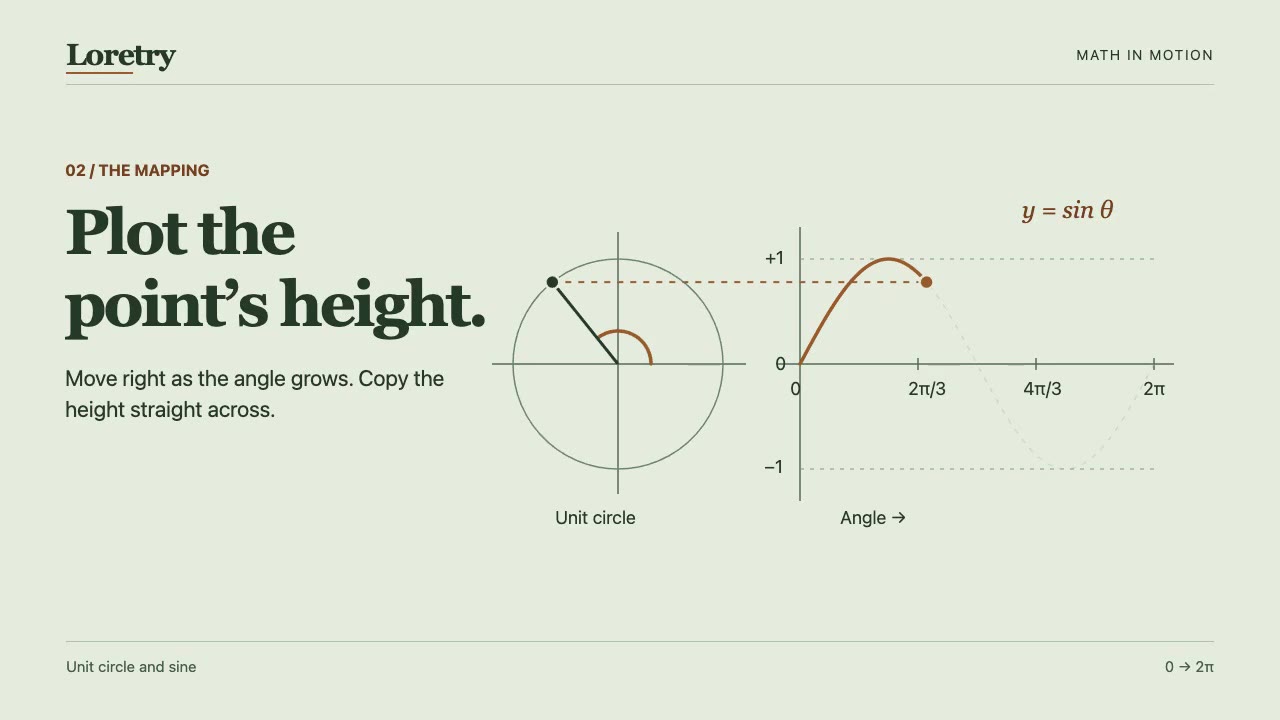
The height of a point on the unit circle is the sine of its angle. Watch the horizontal guide carry that height to the graph. One full turn draws one period.
For y = sin(θ), start at the circle’s rightmost point, (1, 0). The matching point on the graph is (0, 0): its horizontal coordinate is the angle θ, and its vertical coordinate is the circle point’s height. The circle’s center is not the starting point of the trace.
Is a sine wave a circle?
A sine wave plots the vertical coordinate of a point on a unit circle against its angle. The circle shows the point’s path; the sine graph shows how its height changes. One full turn, from 0 to 2π radians, gives one period of y = sin(θ).
In the animation above, follow the horizontal guide: the point on the circle and the point on the graph share the same height.