
Animated Line Chart Example
- Fixed axes
- Quiet grid
- Growing trace
- Illustrative scale
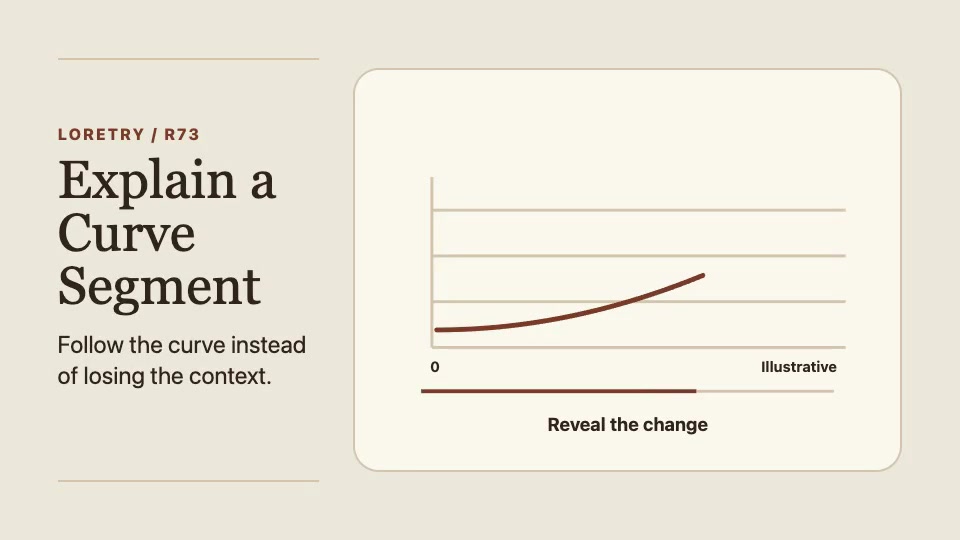
Animate one change in a line chart
This 12-second example draws an illustrative curve. It shows how to explain a change while keeping the chart’s axes in view.
- Establish the scale before drawing the line. Label both axes and their units in your own chart.
- Trace the interval you want to explain while holding the same scale and frame.
- In your version, attach a callout to a value from the source, with its date or x-coordinate.
Use this example to explain one interval in a line chart. To compare two conditions in a research figure, see the research figure animation example, which focuses on reading the axes, comparing conditions and limiting the claim to what the figure supports.
Brief to reuse. Keep [axes and units] visible. Reveal [interval] and label [the verified point]. Attach the source table or figure so the final callout can be checked.
Read the chart and research figure animation guidance